
Egress traffic in multi-cloud Kubernetes: do I need to worry?
By Jakub Hlavačka
11 January 2024
Introduction
In the world of cloud computing, egress traffic represents the network data that exits an entity or a private network within a cloud infrastructure and heads toward the public internet. Many cloud providers charge you for such outbound data transmission, which means you should account for it when designing your multi-cloud Kubernetes solution.
In this article, we will try to answer how much a multi-cloud Kubernetes cluster is going to cost you on the traffic egress fees.
Data gathering
Our environment consists of two different Kubernetes clusters: a small-scale cluster with 3 master and 3 worker nodes, and a mid-sized cluster featuring 3 master and 25 worker nodes. To build these clusters faster, we have used the open-source solution, Claudie, which comes with built-in support for multi-cloud and hybrid-cloud Kubernetes clusters.
We used the Wireshark tool to capture the network traffic data in our clusters. The capturing was performed only on the master nodes since the total network traffic between the worker nodes varies based on the communication between workloads. However, we have conducted some experiments and found out that the average network traffic between any pair of worker nodes is approximately 0.65MB per hour on top of the useful workload traffic. This value applies regardless of the total worker node count in the cluster and we will use it later in our calculations.
Network traffic in the clusters
In this section, we will take a look at the effects of various factors on network traffic. To explore this domain to the fullest, we performed network traffic captures across multiple workload scenarios within both the small (3M x 3W) and medium (3M x 25W) clusters.
Each scenario involves capturing network traffic over the course of an hour, with the only differentiator being the nature of the deployed workload. This approach enables us to see distinctions between the small and medium-sized clusters for each workload scenario, as well as to point out the differences between workload types.
Let’s now take a look at our workload scenarios:
Deployment with 3 pods - Right at the beginning of the network traffic data capture, we create a deployment with 3 NGINX application replicas. During the data-capturing period (1 hour) we avoid making any modifications or interacting with the cluster.
Deployment with 25 pods - In this case, we increase the size of the workload to 25 pods, all other things will be equal to the previous scenario.
Upscaling/downscaling 3 to 6 pods - In the third workload scenario, we scale up and down the NGINX application deployment's replica count from 3 to 6. The deployment, with 3 initial replicas, is created right at the beginning of the data-capturing period. Then, after the first 10 minutes, we scale it up to 6 replicas, maintaining this level for 10 additional minutes before scaling it back down to 3 replicas. This cycle of upscaling and downscaling, spanning 20 minutes, is repeated three times during the data-capturing period. Importantly, we avoid any other actions during this time.
Upscaling/downscaling 25 to 50 pods - In the final workload scenario, we scale the deployment between 25 and 50 replicas. Again, the frequency of the scale-ups and scale-downs remains the same, and all other parameters will be equal to the previous case.
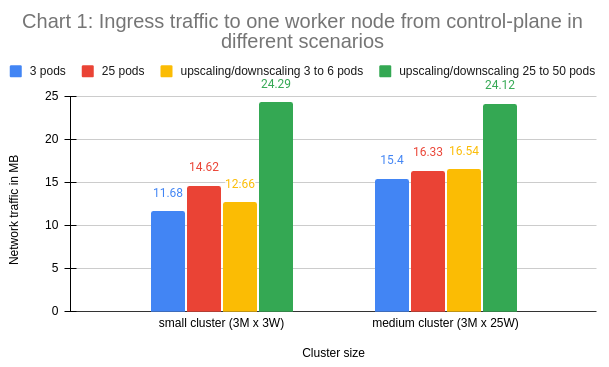
The first chart displays ingress traffic to one worker node from control-plane across all the workload scenarios.
The second chart again presents the network traffic data across all of our workload scenarios, but in this case, it is total egress traffic from one worker node to control-plane.

As expected, the last workload scenario (upscaling/downscaling 25 to 50 pods) generated the most network traffic in each cluster since both the workload size and the cluster activity levels are significantly higher when compared to the other scenarios.
Financial costs of egress traffic
How much does this all cost then? Let’s do the math. Let’s take the last scenario which incurred the highest traffic volumes. Converting the collected hourly data in a linear fashion to a monthly view, we’ll end up with the following numbers.
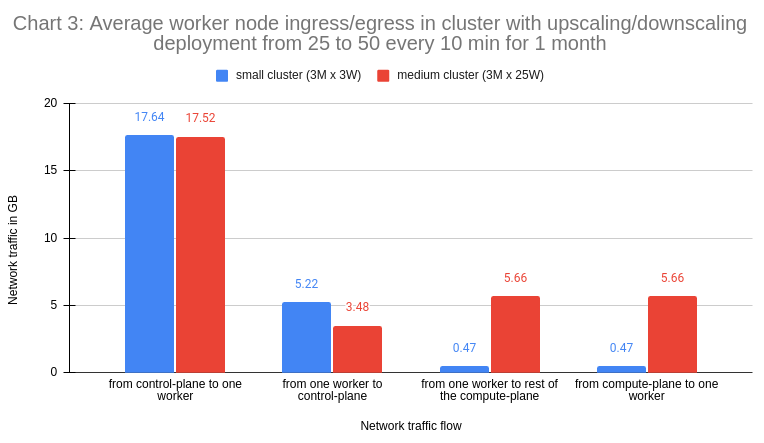
The metrics found in Chart 3, specifically "from one worker to rest of the compute-plane" and "from compute-plane to one worker", were derived from the average aggregate network traffic between two workers (0.65MB), as detailed in the Data Gathering section.
In the following table, you can see the costs for network traffic in the multi-cloud clusters of medium size (3M x 25W) with the last workload scenario spanning 1 month. These costs were incurred by adding one worker node from a specific cloud provider to a K8s cluster hosted on a different provider.
| Ingress + egress costs | AWS worker | GCP worker | Azure worker |
| AWS-hosted cluster | X | 2.09$ + 1.10$ | 2.09$ + 0$ |
| GCP-hosted cluster | 2.78$ + 0.82$ | X | 2.78$ + 0$ |
| Azure-hosted cluster | 0$ + 0.82$ | 0$ + 1.10$ | X |
Since we now know the network traffic costs incurred by using worker nodes from a specific cloud provider in K8s clusters hosted on a different one, we can compare them to a price for worker nodes. These comparisons are presented in the table below.
| Traffic cost relative worker price |
AWS worker (EC2 t4g.small) |
GCP worker (e2-small) |
Azure worker (B2s instance) |
| AWS-hosted cluster | X | 26.08% | 6.88% |
| GCP-hosted cluster | 28.8% | X | 9.15% |
| Azure-hosted cluster | 6.56% | 8.99% | X |
Conclusion
The cost of egress traffic in multi-cloud Kubernetes clusters depends on various factors, including cluster topology, workload structure, workload size, and cluster activity.
The bottom line is that multi-cloud Kubernetes is more expensive than single-cloud, however, the biggest impact would come from the workload topology. The direct cost impact from K8s communication overhead is very light.
However, the situation will be very different on a cluster that uses many K8s controllers and large Custom Resources. They contribute to the overall size of the cluster state and significantly increase the internal K8s communication overhead. For a better understanding of this factor, we recommend seeing the following KubeCon talk by Thomas Graf: https://youtu.be/7qUDyQQ52Uk?t=1102