
Evaluating etcd’s performance in multi-cloud
By Adam Stawski
12 May 2023

Generated with carbon.now.sh
1. Intro
Many companies are focusing on making their workload as highly available as possible. The intention behind moving their workloads from local datacenters to cloud is to provide their application with resiliency to all kinds of downtime and service downgrade. Typically, this type of migration can be associated with the usage of Kubernetes, as it is regarded as the number one cloud-native tool for managing distributed applications. The most common practice when setting up a High Availability Kubernetes cluster is to deploy it in multiple zones, sometimes even in multiple regions, using a cloud provider of choice. In case of a disaster, this approach gives the affected part of the application the possibility to failover to a different datacenter with minimal or even no downtime. Designing this type of architecture can be challenging due to the limitations imposed by what I would call a “Kubernetes brain”, by which I mean the etcd database. As etcd’s official FAQ section states:
etcd is a consistent distributed key-value store. Mainly used as a separate coordination service, in distributed systems.
etcd manages to preserve its data consistency among a distributed cluster by using the Raft algorithm. A scattered cluster requires a node quorum: the majority of nodes has to agree on updates to the cluster state to operate properly. The performance of Raft acquiring such consensus is influenced mainly by two factors: the latency of the network and of the disk. In a typical cloud environment, customers can alter the disk parameters. Moreover, the network infrastructure among a single cloud provider zones/networks can be elevated by its underlying interconnectivity – one example of such interconnectivity is AWS. But what about a situation where we don’t want to rely on a single cloud provider? How is an etcd cluster influenced by the connection over WAN in multi-cloud architecture? This article tries to determine these boundaries.
2. Cluster architecture
The examination was performed on a cluster distributed among three cloud providers:
Google Cloud Platform
Microsoft Azure
Hetzner Cloud

A multi-cloud deployment of a Kubernetes cluster.
Each provider was used to host two Kubernetes worker nodes and a single control-plane node, which created a Kubernetes cluster with 3 control-plane nodes + 6 worker nodes. All of the nodes were bundled with an additional layer of network protection provided by Wireguard VPN, which encrypted the network flow over WAN between different cloud providers. Each instance was hosted on Ubuntu 22.04, with hardware configuration of 4 vCPUs, 16GB RAM and a 100GB hard drive. All the node dependencies were provisioned with Ansible, and Kubernetes itself – in which etcd was deployed as Kubernetes Pods – was installed using Kubeone. A dedicated automation tool for provisioning this type of solution can be found here.
3. Test cases and methodologies
To measure the performance of etcd in Kubernetes, I prepared four test environments. The first one was a point of reference, where the cluster was deployed within a single cloud and a single region, with a small distance difference between availability zones of GCP. The other environments were hosted by multiple cloud providers. Each one had greater geographical distance between the provider regions than the previous one. Here is a more detailed description of the test scenarios:
Scenario-0
| GCP | europe-west3-a | Frankfurt, Germany |
| GCP | europe-west3-b | Frankfurt, Germany |
| GCP | europe-west3-c | Frankfurt, Germany |
Distance:
Control nodes located in the same region, different AZs
SCENARIO-1
| Hetzner | fsn1 | Falkenstein, Germany |
| GCP | europe-west-3 | Frankfurt, Germany |
| Azure | germanywestcentral | Frankfurt, Germany |
Distance:
Falkenstein <> Frankfurt ~ 130 km
SCENARIO-2
| Hetzner | nbg1 | Nuremberg, Germany |
| GCP | europe-west-1 | St. Ghislain, Belgium |
| Azure | westeurope | Amsterdam, Netherlands |
Distance:
Nuremberg <> St. Ghislain ~ 530 km
Nuremberg <> Amsterdam ~ 530 km
St. Ghislain <> Amsterdam ~ 220 km
SCENARIO-3
| Hetzner | fsn1 | Falkenstein, Germany |
| GCP | europe-southwest1 | Madrid, Spain |
| Azure | uksouth | London, UK |
Distance:
Falkenstein <> Madrid ~ 1600 km
Falkenstein <> London ~ 936 km
Madrid <> London ~ 1260 km
4. Performance monitoring
To generate traffic to etcd, I created a script that applies a Kubernetes manifest which deploys a fixed amount of workload to the cluster. This manifest deploys:
10 x deployment
50 x replicas for each deployment
1 x service bound to each deployment
This results in about 1000 entries into the etcd database, including the data about pods, replicasets, deployments, services and endpoints. The script monitors all of the Pods, and waits for them to get into the Ready state. Running it with the time command allows us to estimate how long it takes for all the resources to change their state to Ready. This was performed 10 times on each cluster, the results were gathered and the average deployment time was calculated.
While running those benchmarks, a monitoring solution based on Prometheus stack was present, which was monitoring the Kubernetes etcd instances. For these tests, I created a custom Grafana dashboard that displayed the etcd metrics of my choice. It was monitoring etcd Cluster health state, request RTT in the etcd nodes, Slow Applies to the database, as well as etcd response time to the KubeAPI.
The final test was the most direct, as I chose to use the etcd benchmark tool. It measures and displays etcd statistics like Req/sec, latency, and total execution time. Each test was executed from an etcd peer node connected to the leader node. This is the exact command used:
benchmark --endpoints=192.168.2.1:2379 --target-leader --conns=1 --clients=1 put --key-size=8 --sequential-keys --total=10000 --val-size=256 --cacert /etc/kubernetes/pki/etcd/ca.crt --cert /etc/kubernetes/pki/etcd/peer.crt --key /etc/kubernetes/pki/etcd/peer.key
5. Result comparison
First, let’s take a look at Scenario-0’s case. As I mentioned earlier, it provides us with a point of reference, as it is a rather classic HA setup, where the control-plane nodes are located in the same region/different availability zones of a single cloud provider.
Execution time and request per second
| Total time | 50.9 |
|---|---|
| REQ/SEC | 196.5 |
Request latency time distribution
| 99.9% | 0.0136s |
| 99% | 0.0089s |
| 95% | 0.0067s |
| 90% | 0.0059s |
| 75% | 0.0053s |
| 50% | 0.0049s |
| 25% | 0.0046s |
| 10% | 0.0042s |
Workload deployment time
| 1 | 67s |
| 2 | 64s |
| 3 | 71s |
| 4 | 64s |
| 5 | 67s |
| 6 | 66s |
| 7 | 62s |
| 8 | 68s |
| 9 | 64s |
| 10 | 68s |
| Calculated average | 66.1s |
At the time of the Workload test being performed, Prometheus was collecting all the metrics of etcd. They were displayed on a Grafana dashboard.

Etcd dashboard in Grafana for Scenario-0
Metrics observation:
etcd Cluster health wasn’t influenced in any way, all Health Checks were successful
Request RTT: values varied between 0.0032 s to 0.0256 s
KubeAPI request duration: values varied between 0.005 s to 0.025 s
etcd Slow Applies: insignificant amount, around 300 in the provisioning time and didn’t increase while running the load test
Now, let’s take a look at the test scenarios run in the multi-cloud deployment and compare it to the single cloud provider design. The following is an etcd benchmark tool summary, with the results from Scenario-0:

All four scenarios metrics for etcd benchmarks total time and request per second

All four scenarios metrics from etcd benchmark tool
When comparing metrics from the etcd benchmark tool, the conclusion is straightforward: the greater the distance between the etcd nodes, the higher the request latency time. There is also network throughput degradation in all multi-cloud scenarios. However, how does this affect a Kubernetes cluster?
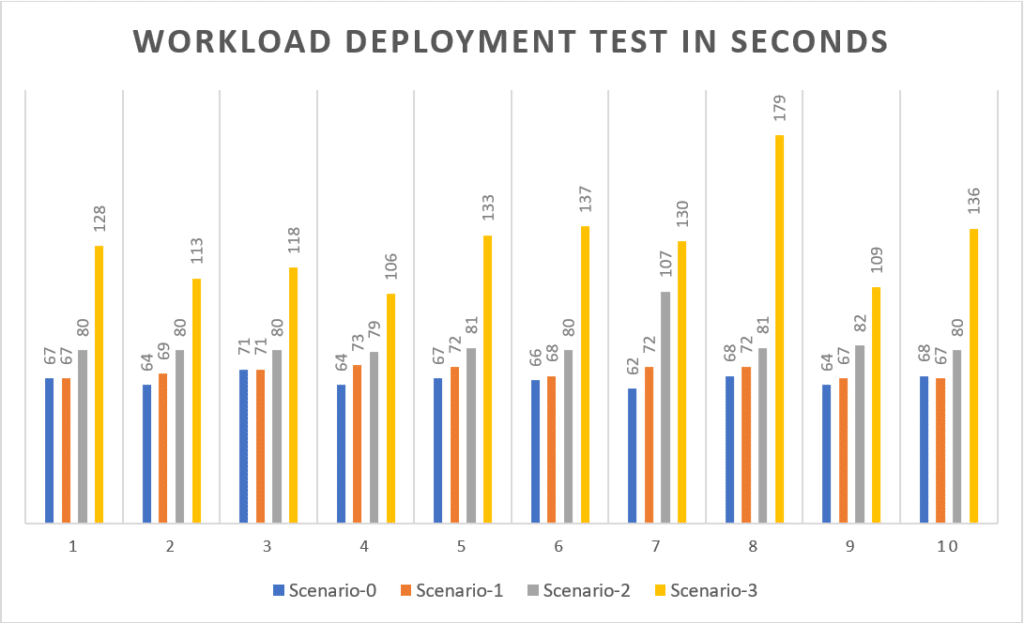
All four scenarios metrics for deploying workload into Kubernetes cluster
The average deployment time for each scenario:
Scenario-0: 66.1 s
Scenario-1: 69.8 s
Scenario-2: 82.9 s
Scenario-3: 128.9 s
Grafana metrics observation:
etcd Cluster health: The amount of Health check Failures is close to 0. While running the tests, none of the test scenarios were affected by cluster health deterioration.
The Round-Trip Time Histogram displays a predictable outcome. This metric shows a noticeable increase when testing:
Scenario-0 RTT varies from 0.0032 s to 0.0256 s
Scenario-1 RTT varies from 0.0032 s to 0.0512 s
Scenario-2 RTT varies from 0.0128 s to 0.1024 s
Scenario-3 RTT varies from 0.0512 s to 0.2048 s
KubeAPI Request duration: all scenarios had a low Request duration with a slight increase from 0.025 s to 0.25 s, except for Scenario-0, where the duration was even shorter and varied between 0.005 s to 0.025 s
etcd Slow Applies: Scenario-1 and Scenario-2 showed values around 600 – 1200 of Slow Applies on a single peer node in the cluster. In Scenario-3, this amount skyrocketed on every peer node in the cluster to values exceeding 60000 on one node, and 140000 on another node:

Scenario-3 etcd dashboard, Slow Applies
6. Conclusion
While performing the test, I only encountered a disturbance in Scenario-3. Extended deployment time was followed by multiple errors in the process. Runs were interrupted multiple times with errors:
E0207 13:31:16.902027 21979 request.go:1058] Unexpected error when reading response body: read tcp 192.168.0.117:54242->159.69.189.211:6443: read: connection reset by peer
Adding to this, by including the etcd’s performance with significantly higher number of Slow Applies and degradation of the etcd benchmark tool, it led me to a conclusion that increasing the distance between etcd nodes to more than 600 km with different cloud providers can be detrimental for the cluster health.
💡 Please note that these values are not to be generalized as hard limits for every Kubernetes cluster in every scenario!
Those are dependent on a number of factors: starting with the cloud provider infrastructure resource tier (some cloud providers offer faster NICs with bigger VM sizes), underlying network infrastructure, size of the workloads in the Kubernetes cluster, and how much traffic they generate.
It is also worth pointing out the little differences between Scenario-0 and Scenario-1. Assuming that our main objective is to be independent from a single cloud provider and, at the same time, to keep the distance between the etcd nodes within a small geographical distance, it is worth taking into account a multi-cloud design for cluster architecture.